Q&A 5 How do you export and visualize database query results?
5.1 Explanation
After querying your database, you often need to share results or explore them visually.
While SQL can output results in text or through phpMyAdmin, Python lets you:
- Export directly to CSV or Excel for reporting
- Use
pandasfor deeper analysis
- Create quick visualizations with
matplotlib
5.3 Python Code (Export + Visualization)
import mysql.connector
import pandas as pd
import matplotlib.pyplot as plt

# Connect to MySQL
conn = mysql.connector.connect(
    host="localhost",
    user="root",
    password="",
    database="cdi_learning"
)

# Query using pandas
query = """
SELECT courses.course_name, COUNT(enrollments.student_id) AS total_students
FROM courses
INNER JOIN enrollments ON courses.id = enrollments.course_id
GROUP BY courses.course_name
ORDER BY total_students DESC;
"""

df = pd.read_sql(query, conn)

# Export to CSV
df.to_csv("data/course_enrollments.csv", index=False)
print("Exported to data/course_enrollments.csv")

# Visualize with matplotlib
df.plot(kind="bar", x="course_name", y="total_students", legend=False)
plt.title("Student Enrollments per Course")
plt.xlabel("Course")
plt.ylabel("Number of Students")
plt.xticks(rotation=45)
plt.tight_layout()
plt.show()

conn.close()
Exported to data/course_enrollments.csv
/var/folders/m1/0dxpqygn2ds41kxkjgwtftr00000gn/T/ipykernel_14374/3001910429.py:22: UserWarning: pandas only supports SQLAlchemy connectable (engine/connection) or database string URI or sqlite3 DBAPI2 connection. Other DBAPI2 objects are not tested. Please consider using SQLAlchemy.
df = pd.read_sql(query, conn)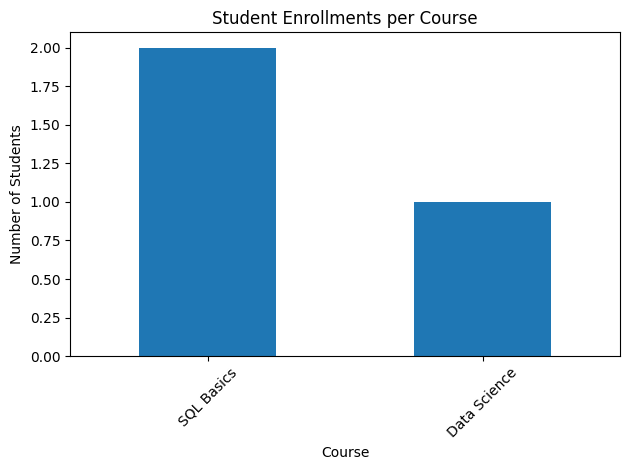
5.4 📌 Notes for Learners
- When using
mysql-connector-pythonwithpandas.read_sql(...), you may see a warning like this:
UserWarning: pandas only supports SQLAlchemy connectable… Other DBAPI2 objects are not tested.
⚠️ Don’t panic — this is not an error.
- The query still runs successfully.
- Results (DataFrame, chart, CSV export) are correct.
- It’s just pandas reminding you that it prefers SQLAlchemy connections.
To avoid this warning, you can switch to SQLAlchemy + PyMySQL (see next chunk below 👇), which integrates smoothly with pandas.
This is considered the recommended best practice for data analysis and production workflows.Rule of thumb for CDI learners:
✅ Use
mysql-connector-pythonfor quick experiments and when you’re just starting.
✅ Use
SQLAlchemyonce you’re comfortable and want cleaner, warning-free workflows that scale better with the Python data stack.
5.5 Switching to SQLAlchemy + PyMySQL
from sqlalchemy import create_engine
import pandas as pd
import matplotlib.pyplot as plt

# Create SQLAlchemy engine
engine = create_engine("mysql+pymysql://root:@localhost/cdi_learning")

# Run query directly into DataFrame
query = """
SELECT
    courses.course_name,
    COUNT(enrollments.student_id) AS total_students
FROM courses
LEFT JOIN enrollments
    ON courses.id = enrollments.course_id
GROUP BY courses.course_name
ORDER BY total_students DESC;
"""
df = pd.read_sql(query, engine)

print(df)

# Plot
df.plot(kind="bar", x="course_name", y="total_students", legend=False)
plt.title("Student Enrollments per Course")
plt.xlabel("Course")
plt.ylabel("Number of Students")
plt.xticks(rotation=45)
plt.tight_layout()
plt.show()
course_name total_students
0 SQL Basics 2
1 Data Science 1
2 Python Programming 0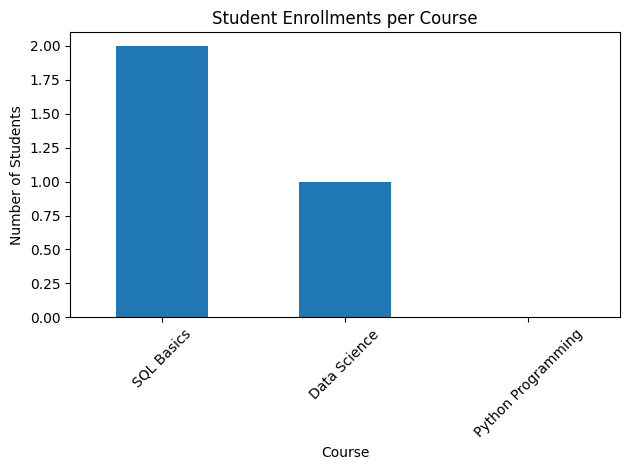
5.6 ✅ Learning Outcome
By the end of this Q&A, you will be able to:
- Run aggregate queries with
GROUP BYandJOIN - Retrieve query results into a pandas DataFrame
- Export query results to CSV (and Excel if desired)
- Create bar chart visualizations directly from database queries
- Understand the difference between using
mysql-connector-pythonand SQLAlchemy with pandas
5.7 🧠 Takeaway
SQL gives you the numbers; Python tells the story.
Use SQL for structured queries, pandas for analysis, and matplotlib for clear visualizations.
Start simple withmysql-connector, then adopt SQLAlchemy for cleaner, warning-free workflows that scale.
💡 Tip: Always begin with a SELECT * to explore, then narrow down with WHERE, GROUP BY, and ORDER BY.
💡 Tip: Start with SQL in phpMyAdmin or CLI to test your logic. Then, once the query works, drop it into Python for analysis, export, or visualization.